summary
TROCCO's Data Catalog allows you to view ER diagrams between specified tables.
It also supports JOIN analysis, which allows you to visually check the relationship between two tables.
JOIN analysis can only be performed between tables with Column Setting references.
For information on how to define a column reference, see Manual Column Setting.
Tables transferred to the data store using a specific Data Source Connector in TROCCO will automatically have Column Settings defined.
For more information, see Connectors Subject to Automatic Column Setting.
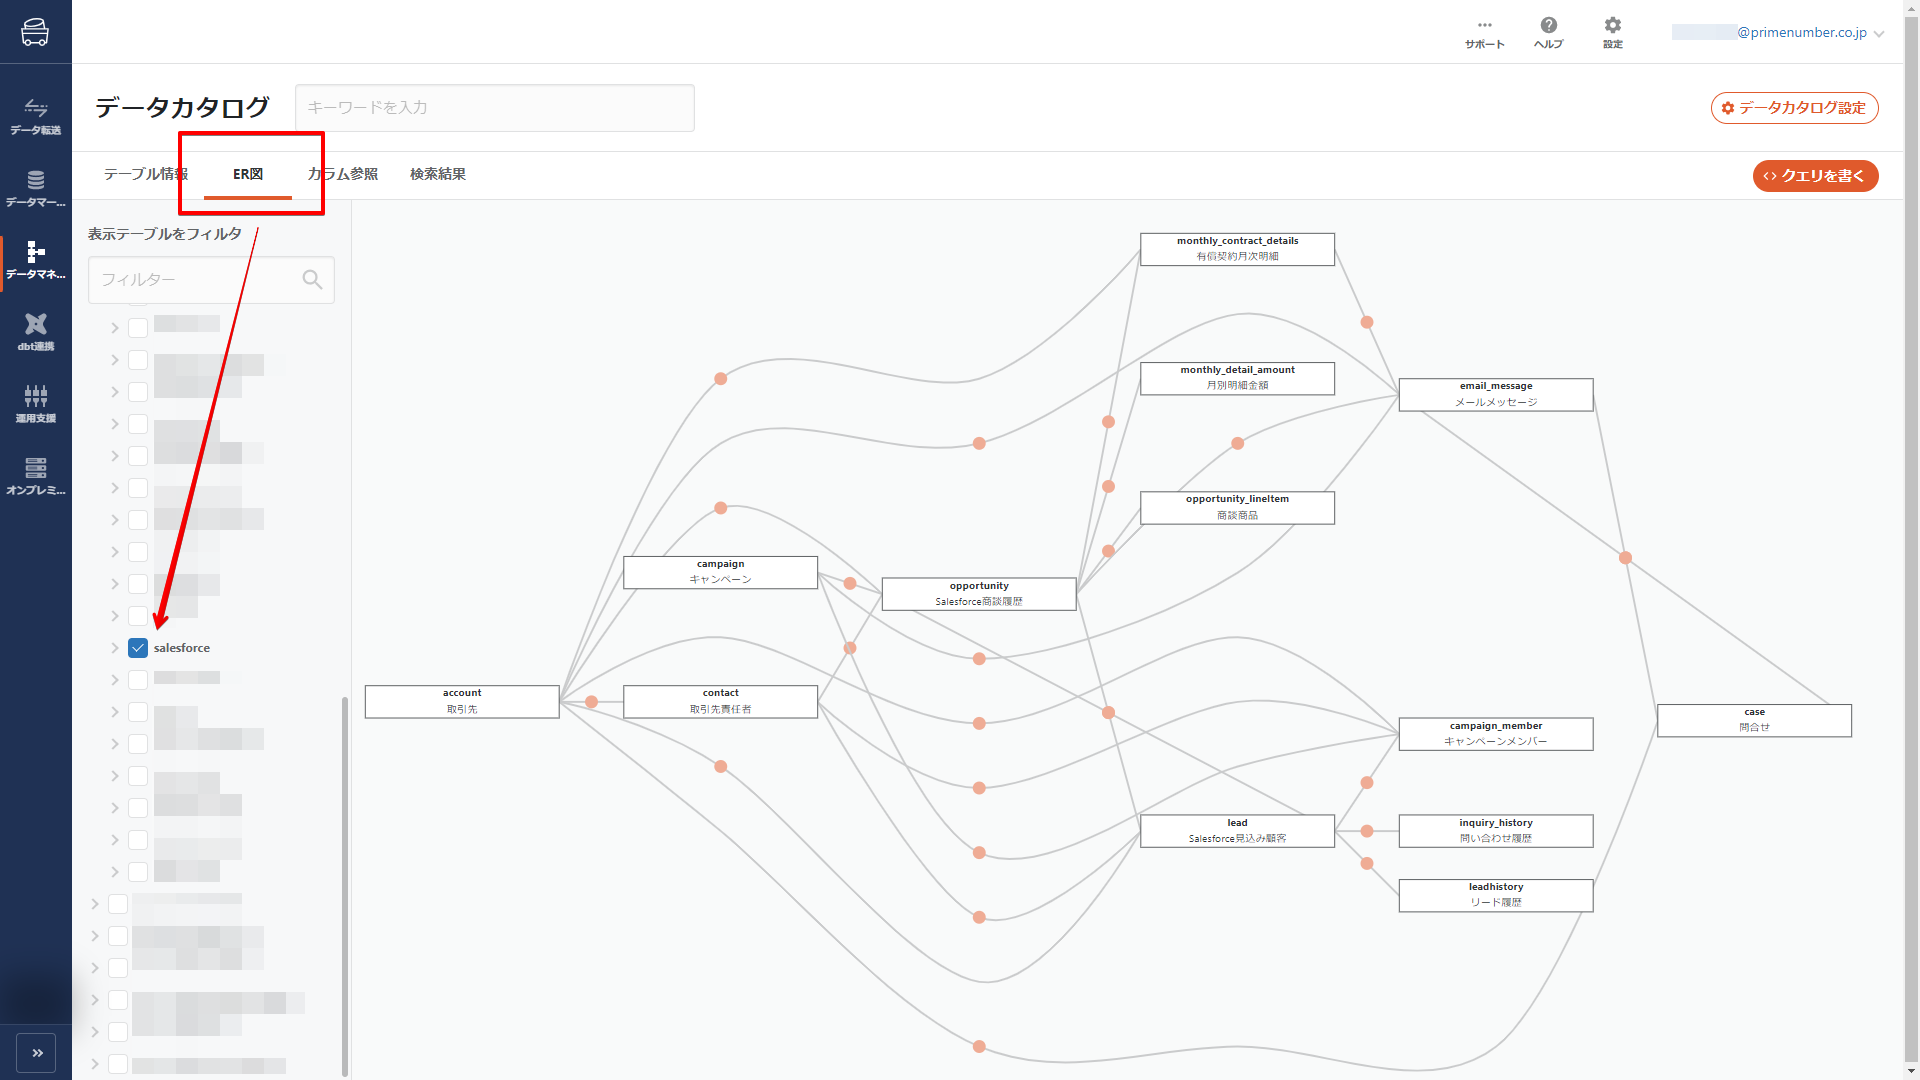
ER diagram
It is displayed by clicking on the ER Diagram tab and selecting the table from the Display Tables filter.
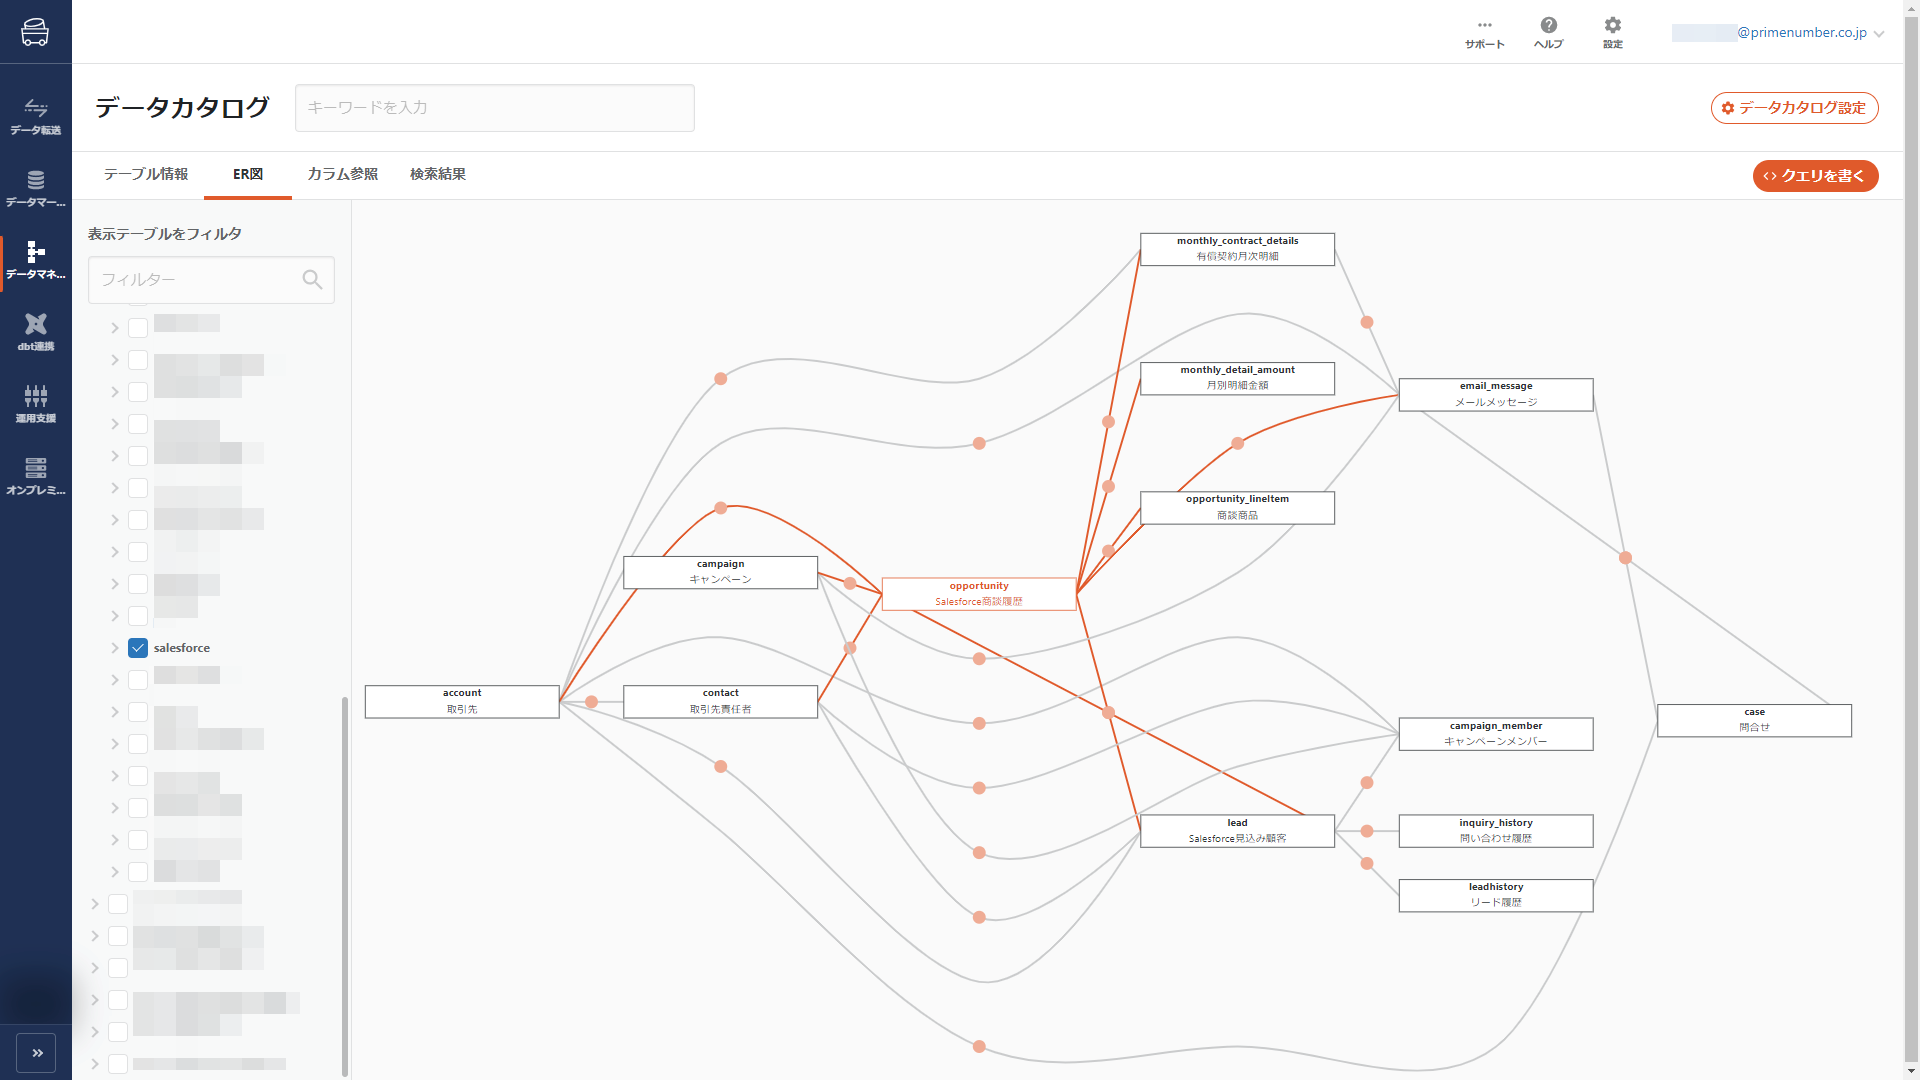
Mouse over a table to highlight the line to the related table.
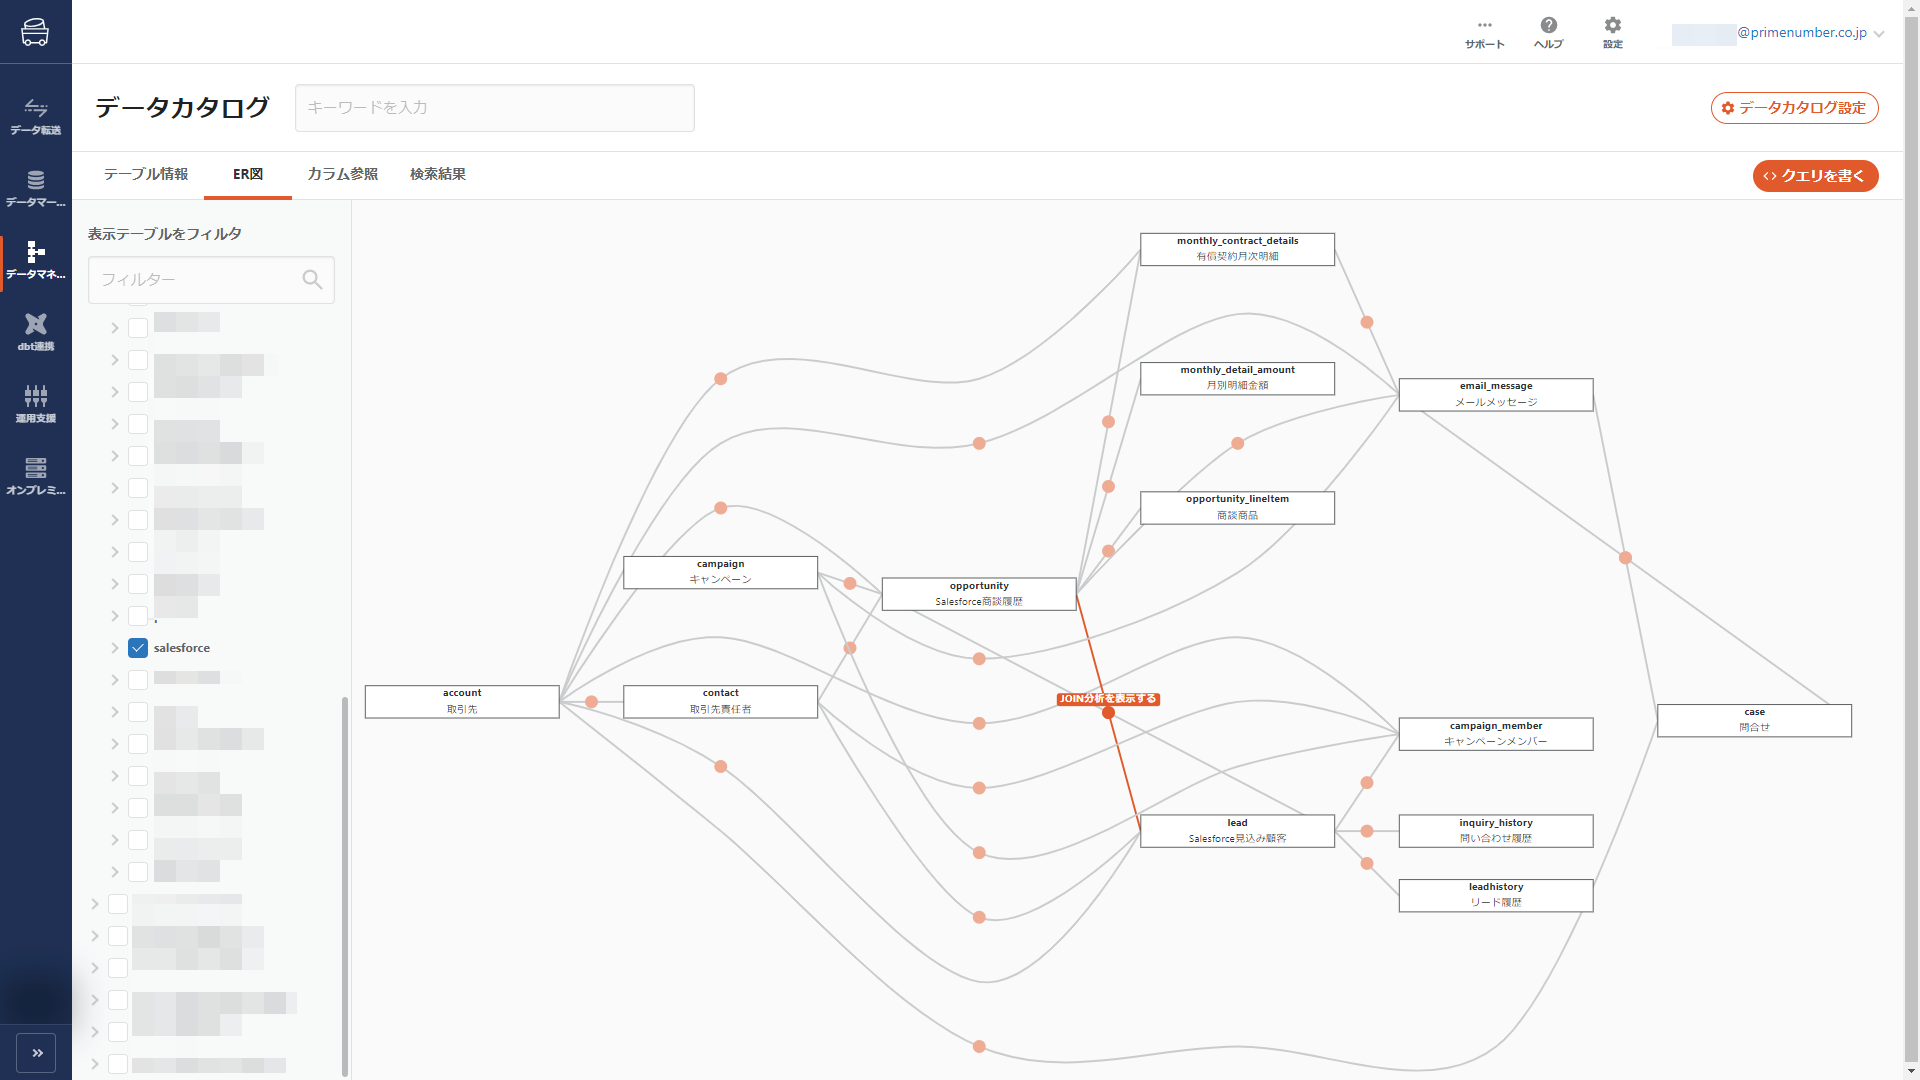
How to display JOIN analysis
Mouse over the midpoint of the line connecting the tables to see the JOIN key.
Click on the midpoint as it is, and the JOIN analysis will be displayed.
JOIN Analysis
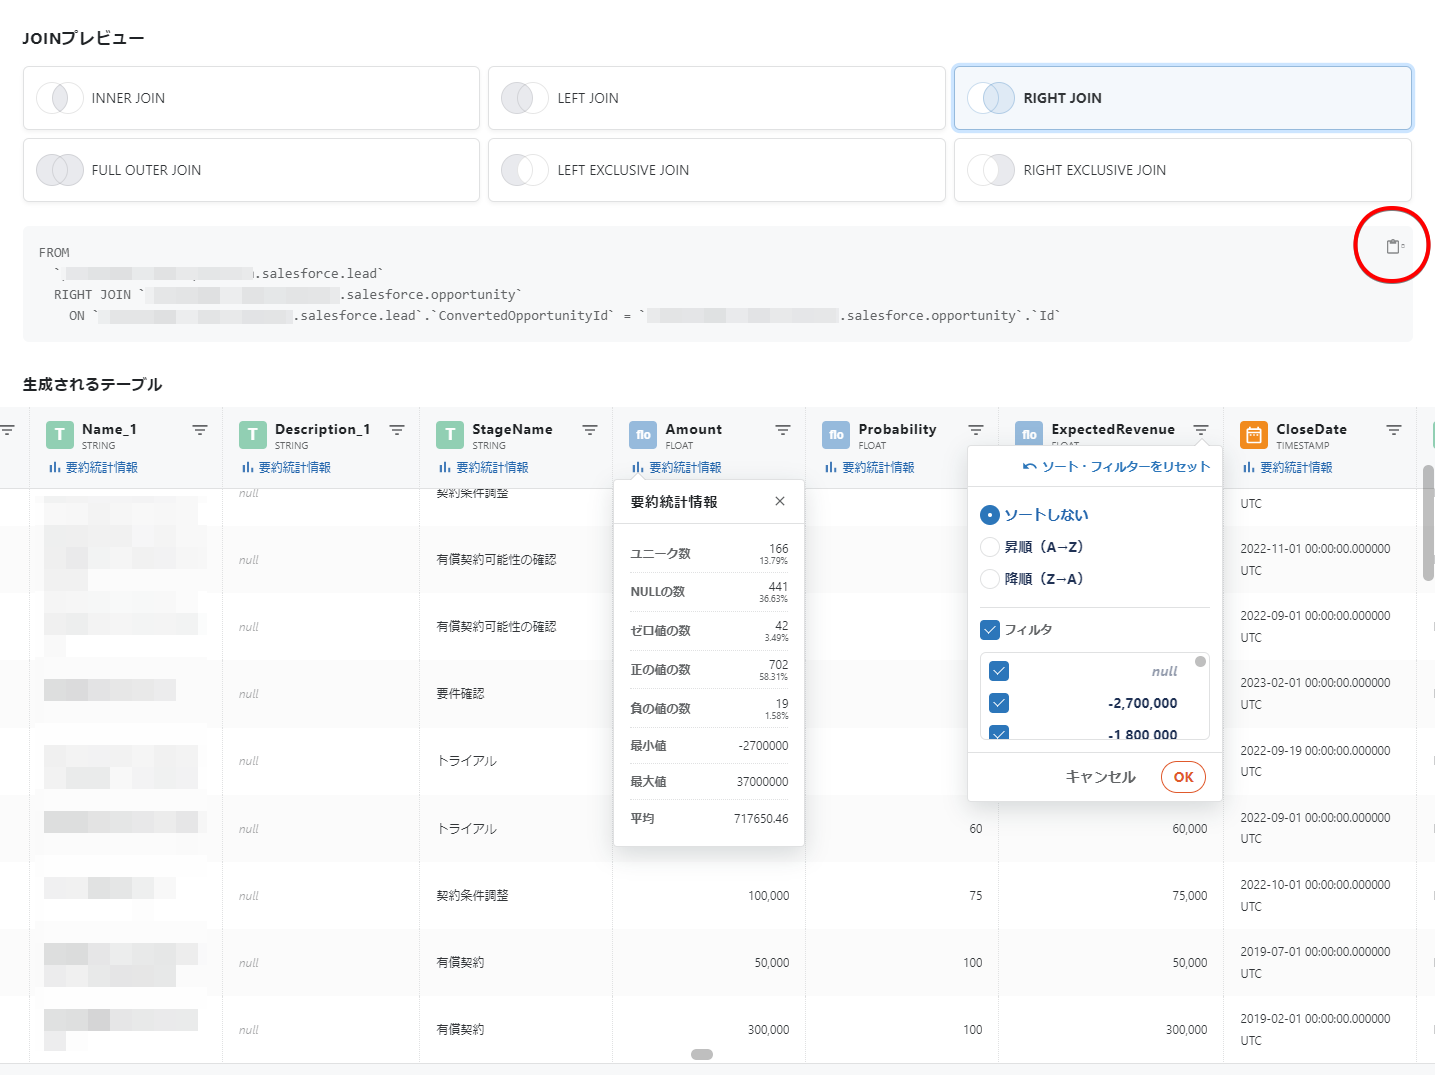
JOIN analysis allows you to check the information you want to see when joining two tables, such as the JOIN key, number of uniques, and number of nulls.
The number of rows generated when joining two tables can also be visually confirmed by a Venn diagram.
Click on View JOIN Analysis to perform the analysis.
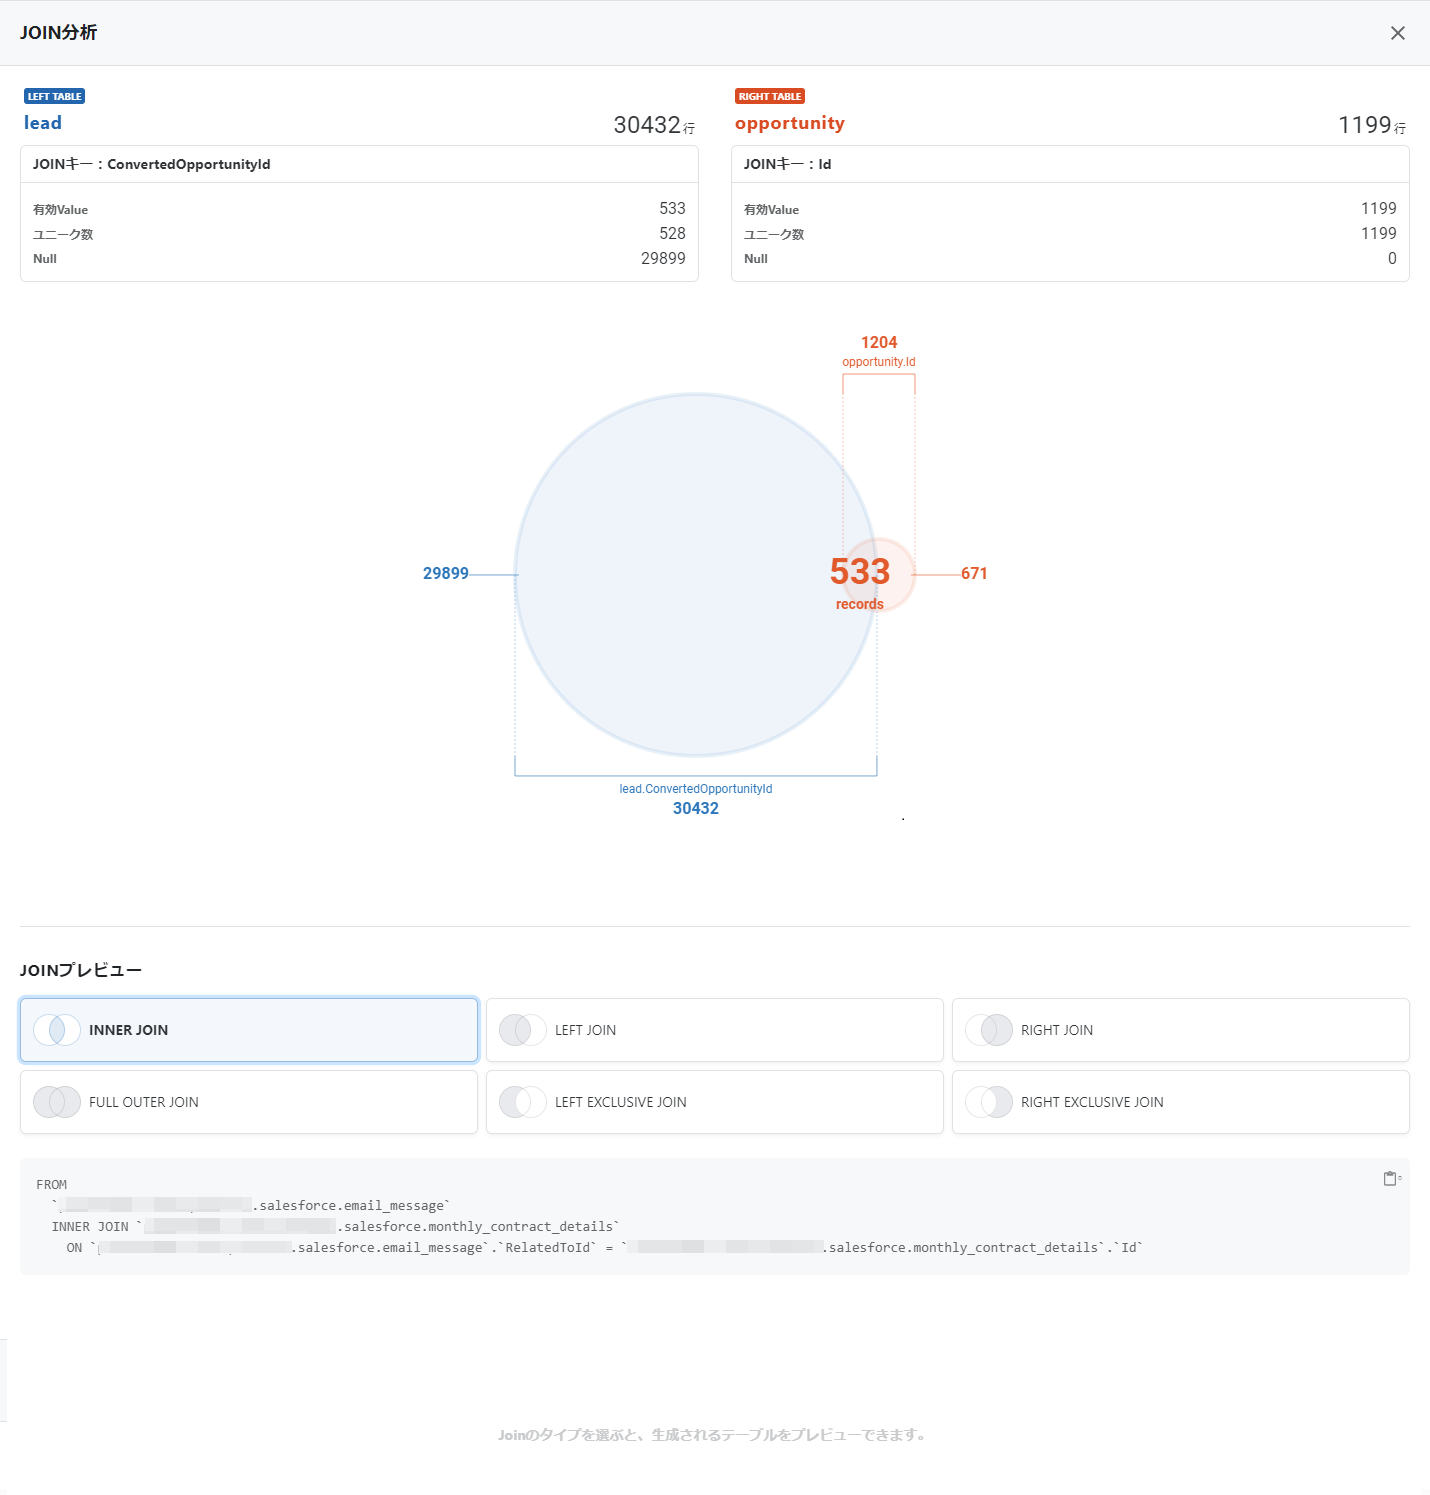
You can also choose any table join type in the JOIN preview to see a preview of the joined tables.
A query for table joins is also displayed.
Queries can also be copied by clicking on the icons in the red box below.